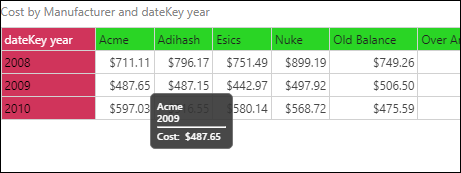
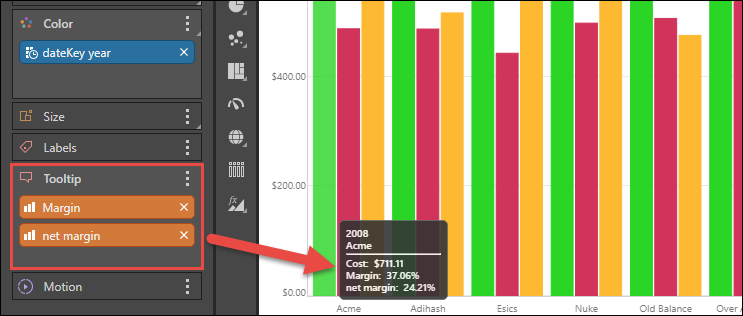
Users may add extra measures to the Tooltip drop zone to reveal additional information in the tooltip. Measures added to the tooltip zone will not appear in the visualization, but will be included in the tooltip. Hovering over a data point in the visualization exposes detailed information about that data point in the form of a tooltip. The tooltip lists all the member elements and measures in the given data point. The tooltip drop zone allows users to expand the options of what is shown in the standard tooltip.
Note: Tooltips may be disabled from the Design ribbon as needed.
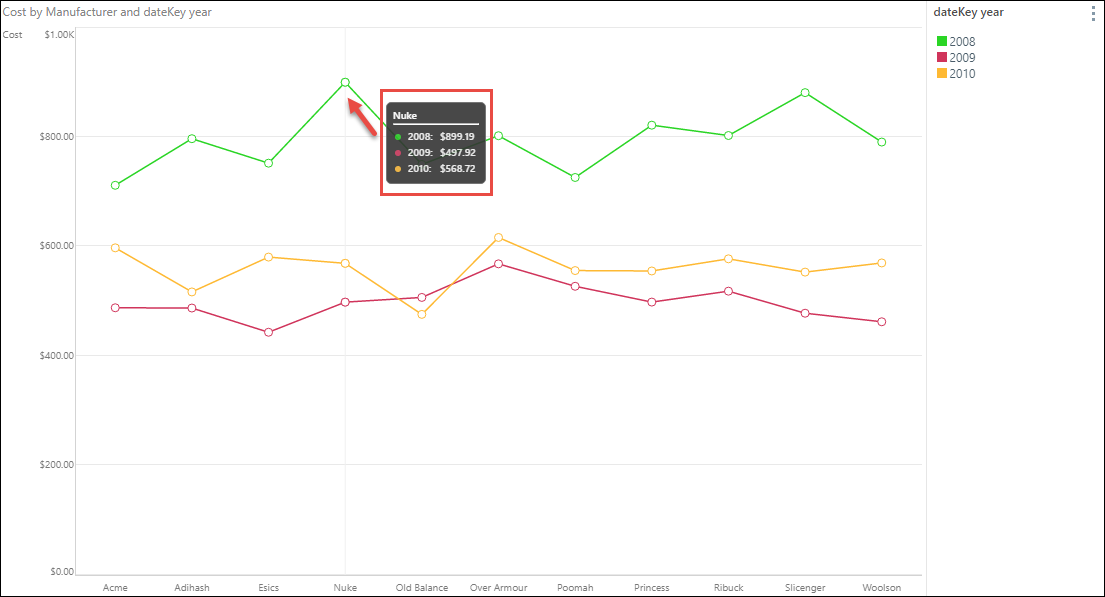
Tooltips for Line and Area Charts
There are 2 types of tooltips when working with line and area charts; the tooltip behavior will depend on whether or not data points have been enabled.